Debugging Keyboard Shortcuts: The Complete Guide
Learning keyboard shortcuts can save you tons of time when coding. Instead of mousing around menus and forms, you can keep your hands on the keyboard and work more efficiently.
This is especially true when debugging code, where you may need to quickly set breakpoints, step through code line-by-line or examine variables.
In this guide, we’ll cover the most useful basic debugging keyboard shortcuts supported by popular integrated development environments (IDEs) like Visual Studio, Visual Studio Code, Eclipse, and IntelliJ.
Whether you’re just starting out or are looking to learn some new tricks, read on to boost your debugging productivity!

What is Debugging?
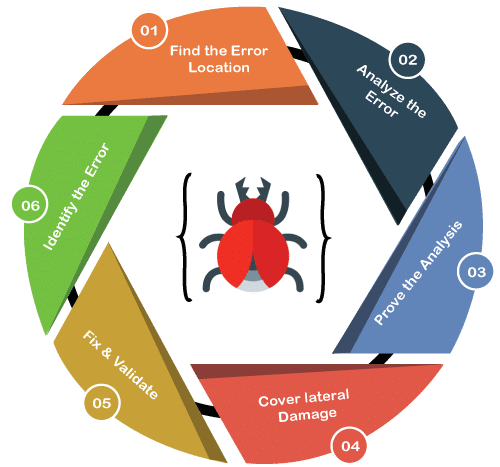
Debugging means finding and fixing errors and problems in computer programs.
These issues that prevent code from working correctly are called “bugs”. Debugging helps you locate bugs, figure out why they happen, and edit the code to resolve them.
Some common debugging tasks include:
- Stepping through program execution one line at a time
- Setting breakpoints to pause execution at certain lines
- Inspecting variable values while paused
- Monitoring changes to values or program state
Mastering debugging keyboard shortcuts for these tasks can help find and squash bugs more efficiently.
Popular Debugging Keyboard Shortcuts
Here are some of the most popular keyboard shortcuts used for debugging across IDEs and languages:
| Action | Visual Studio | VS Code | Eclipse | IntelliJ |
|---|---|---|---|---|
| Start/Continue Debugging | F5 | F5 | F8 | Alt+Shift+F9 |
| Stop Debugging | Shift+F5 | Shift+F5 | Ctrl+F2 | Shift+F9 |
| Step Over | F10 | F10 | F6 | F8 |
| Step Into | F11 | F11 | F5 | F7 |
| Step Out | Shift+F11 | Shift+F11 | F7 | Shift+F8 |
| Toggle Breakpoint | F9 | F9 | Ctrl+Shift+B | Ctrl+F8 |
Let’s look at what each of these shortcuts does when debugging:
- Start/Continue: Begin execution or continue after stopping. This runs code normally until the next breakpoint.
- Stop Debugging: Pause execution and terminate the debugging session.
- Step Over: Execute the current line without going into any functions, advancing to the next line.
- Step Into: Execute the current line and debug inside any functions called on that line.
- Step Out: Continue execution until the current function exits, going back to where it was called.
- Toggle Breakpoint: Insert or remove a breakpoint on the current line. Breakpoints pause execution to let you debug.
Memorizing these shortcuts allows you to step through code, analyze data, and alter execution flow without needing to use the mouse.
Handy Debugging Shortcuts in Visual Studio
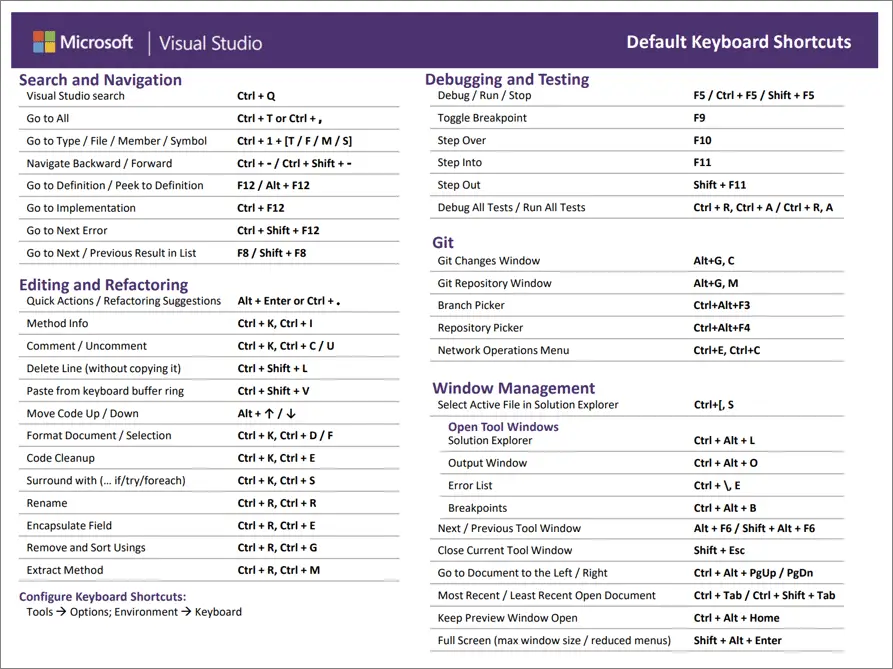
Beyond those universal options, Visual Studio has some additional handy keyboard shortcuts when debugging:
| Action | Keyboard Shortcut |
|---|---|
| Show Next Statement | Alt+Num * |
| Show Previous Statement | Ctrl+Shift+Num – |
| Run to Cursor | Ctrl+F10 |
| Set Next Statement | Ctrl+Shift+F10 |
| Enable/Disable Breakpoint | Ctrl+F9 |
| Delete All Breakpoints | Ctrl+Shift+F9 |
These allow you to navigate through code, set temporary halt points outside breakpoints, and easily manage your breakpoints.
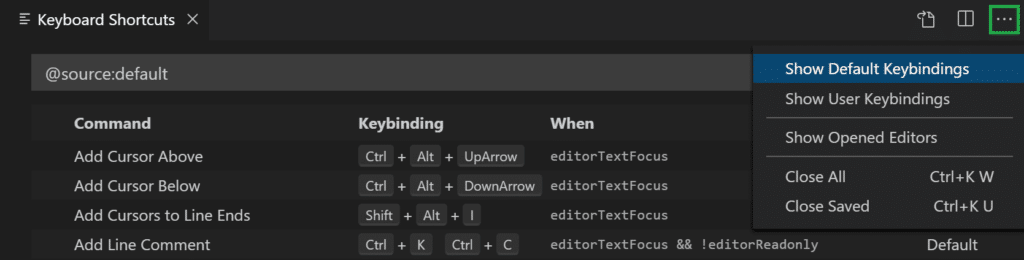
Convenient VS Code Debugging Shortcuts
Like Visual Studio, VS Code has some additional keyboard shortcuts to supplement the standard debugging ones:
| Action | Keyboard Shortcut |
|---|---|
| Toggle Line Breakpoint | Ctrl+B |
| Inline Breakpoint | Shift+F9 |
| Debug Console | Ctrl+Shift+Y |
| Run Selection | Ctrl+F10 |
The inline breakpoint is handy for quickly setting a temporary breakpoint on a line without editing any code.
The debug console lets you directly evaluate expressions, print variables, and execute code while debugging.
Eclipse and IntelliJ Debugging Features
Aside from the common shortcuts listed earlier, Eclipse and IntelliJ also provide debugging superpowers through keyboards tricks like:
- Expressions/Watches – Inspect variables or evaluate code snippets.
- Conditional Breakpoints – Only pause execution when condition is met.
- Tracepoints – Print debug outputs without pausing.
- Frames View – See current call stack of function calls.
Mastering the specific IDE’s tools along with keyboard shortcuts leads to serious debugging efficiencies.
Get Debugging Like a Pro!
Learning debugging keyboard shortcuts accelerates finding and fixing bugs when coding. Whether you remember a few common options or master all the tricks for your IDE, keeping hands on the keyboard saves major time over mousing around when debugging.
The common shortcuts for continuing execution, stepping through code, and toggling breakpoints work across almost all tools and languages.
Combine those with power shortcuts for breakpoints, navigation, and data inspection tailored to Visual Studio, VS Code, Eclipse, or IntelliJ.
Internalize the shortcuts as you repeat debugging tasks, cementing the keyboard patterns into a habit. If you get stuck, most IDEs list their shortcut keys under Help or documentation.
Conclusion
Soon you’ll fix bugs faster than ever, save time stepping through code or managing breakpoints, and feel like a keyboard-command wizard!
Put these debugging shortcuts to work and unlock serious productivity boosts by keeping hands on keys instead of a mouse.